A review of the latest U.S. labor data shows that union membership and organizing elections are declining, but the election win rate and major strike activity is up. What does this all mean, and how can the labor movement revitalize itself? by Eric Dirnbach
At the beginning of each year, the U.S. Bureau of Labor Statistics (BLS) releases annual data on union membership and large strikes. Furthermore, at the end of each year, the National Labor Relations Board (NLRB) releases its annual report on union elections. When all this data arrives is a good time to consider the state of the labor movement, but it’s also depressing because the news is usually not good. Of course this information only captures some aspects of the labor movement, but it’s worth considering what it tells us.
Union Membership
In January, the BLS released its annual Union Members Summary. Union membership declined from 14.74 million to 14.57 million workers, a loss of 170,000 members. The membership rate, also called union density, which is the percentage of the workforce who are union members, declined from 10.5% to 10.3%. The number of workers represented by unions, which includes non-members covered by union contracts, was essentially unchanged, while the rate of representation fell slightly from 11.7% to 11.6%.
Particularly alarming is the really low membership rate for the private sector, declining from 6.4% to 6.2%. This is a rate that was common more than a century ago! Maybe more encouraging news is that the public sector membership rate only declined slightly from 33.9% to 33.6%, and the represented rate stayed unchanged at 37.2%. This is despite some predictions that these rates would drop sharply after the 2018 Janus Supreme Court decision that extended “right to work” rules to the entire public sector. Indeed from 2017 (before Janus) to 2019, public sector union membership only dropped from 7.21 million to 7.07 million, a loss of about 150,000 workers. An extended discussion about the details of the new membership data can be found here and here.
Below is a chart from LBO News showing union density for more than a century. So we can see that the new membership numbers continue the trend of recent decades. Of course this long union decline coincides with an era starting in the 1970s of flat working class wages, increased inequality, and more of the national wealth claimed by capital rather than labor, with workers losing $200 billion per year due to lower union density.

Union Organizing
Union organizing takes a number of forms, but NLRB elections have been the main strategy to organize private sector workers since the 1930s. The NLRB annual election reports have a summary of all the union elections that fiscal year, including the number of elections, the union win rate, and the number of eligible election voters. Below is a chart showing the number of union representation elections of unorganized workers and the union win rate for the last two decades from 2001, which is all the data the NLRB posts on its website.

Two things are pretty clear. The number of elections has been decreasing, reaching a little over 1,000 last year. This is close to the number of elections seen in the very first years of the National Labor Relations Act (NLRA) back in the 1930s, as I show here. The number of elections dropped 50% from the 2001-2003 time period to 2017-2019. However, the union win rate has improved a lot. The rate from 2001-2003 was about 55%, increasing to 70% in 2017-2019. There has been a recent, small (3%) increase in the win rate, possibly due to the NLRB election rule changes in 2015, which decreased the average election time period by two weeks. Those rules will change back again under Trump’s NLRB, so we may see win rates fall back down slightly.
These results follow a very long trend in union elections. Decades ago, unions ran many more organizing campaigns — over 8,000/year in the 1970s — but win rates were down in the 50% range. In recent decades, employer union-busting campaigns have gotten more sophisticated and relentless, as a number of studies have shown, including the 2009 No Holds Barred report and the more recent Unlawful report. So over time, as union membership has declined, and intense union busting has become more standard, unions have concentrated their resources on fewer elections, but are winning more of them. I previously discussed some data from 20 years ago that showed how unions have been able to win more often, even in the face of increased union busting.
Union win rates of 70% are respectable, but this overall level of organizing activity is just too low. Below is a chart showing the number of unorganized workers reported by the NLRB as voting in representation elections, and the number of workers who won their elections (which for the years 2011-2019 I had to calculate because of the way the NLRB changed their data reporting).

The number of workers voting in union elections declined 54% from 2001-2003 to 2017-2019, not surprisingly, since the number of elections dropped by a similar amount. Despite this large decline, the number of workers who won their elections decreased only 28% between those time periods, mostly because the win rate and average winning bargaining unit size increased over time.
But 2017-2019 had an estimated average of about 47,000 newly organized workers per year, which is not really a lot. Compare the gain of the 140,000 organized workers in the last three years to the overall loss of density in the private sector. Union members rose by 72,000 and represented workers rose by 124,000, both less than the number of new workers from elections. The newly organized workers are just dwarfed by the churn of the overall economy, with union workplaces expanding or closing and union workers hired and laid off. Meanwhile, union density continues to fall, because the overall workforce grew even more.
Moreover, there are also decertification elections, in which workers vote to remove a union. These reduce the number of union workers and for the last three years have averaged a little over 5,000 workers lost per year. And this is all before we get to contract negotiations, where according to a 2008 study, only 56% of new bargaining units are able to negotiate a contract within two years (and then likely very few after that). It’s not clear what happens with all these bargaining units but it’s possible that some will revert back to non-union status if workers just can’t get a contract.
Overall, these organizing numbers are just far too low to maintain or grow private sector union density. With an overall workforce of over 140 million workers, including more than 120 million in the private sector, to increase union density by 1% annually, unions would have to organize well over one million workers each year. We are very far from that, but not for a lack of interest among workers. Almost two-thirds of Americans approve of unions, near the highest level in 50-years, and half of non-union workers would vote for a union if they had a chance.
What About Strikes?
In February, the BLS released its annual data on large work stoppages, meaning any strike or lockout that started that year, which involved at least 1,000 workers for at least one shift, but these are mostly strikes. Decades ago there used to be hundreds of large strikes every year, with the BLS historical data showing a high of 470 in 1952, involving 2.7 million workers. In recent years the annual number has been getting very low, dipping below 20 in 2008 and reaching as low as five in 2009 and seven in 2017. The BLS published the chart below a few years ago, which shows the stunning decline in strikes. The big fall starting in the 1980s is often attributed to the legacy of the failed PATCO strike and other losses of that era.

But 2018 saw an increase in large work stoppages to 20, and 2019 surpassed that with 25, the highest in nearly two decades. The number of workers involved were 485,200 in 2018 and 425,500 in 2019, the most since the 1980s. Moreover, the total “days of idleness” of 2.8 million and 3.2 million are the highest since 2004.
What’s going on here? These strikes for the last two years have been led largely by public school teachers and other education workers, accounting for 20 out of the 45 work stoppages, including in many Republican-controlled states. For the last decade since the Great Recession, school funding has declined and teachers and other school workers, starting in West Virginia, finally had enough. I recommend Red State Revolt for a good analysis of several state-wide school strikes. Below is a chart of some of the larger public school strikes from these last two years. And a summary of some of the strike activity from last year is here.

The private sector also had 20 of the 45 large work stoppages in the past two years. It’s perhaps no surprise that large private sector strikes are fairly uncommon because union membership and density are very low. Indeed, we can examine this further by considering another database of private sector work stoppages maintained by the Federal Mediation and Conciliation Service (FMCS). The FMCS tries to mediate in private sector union contract negotiations to prevent strikes and lockouts. It collects information on contracts entering bargaining and on those bargaining units that have engaged in a work stoppage. So it doesn’t have information on all private sector work stoppages, but only the ones that arise out of contract negotiations, which should be most of them.
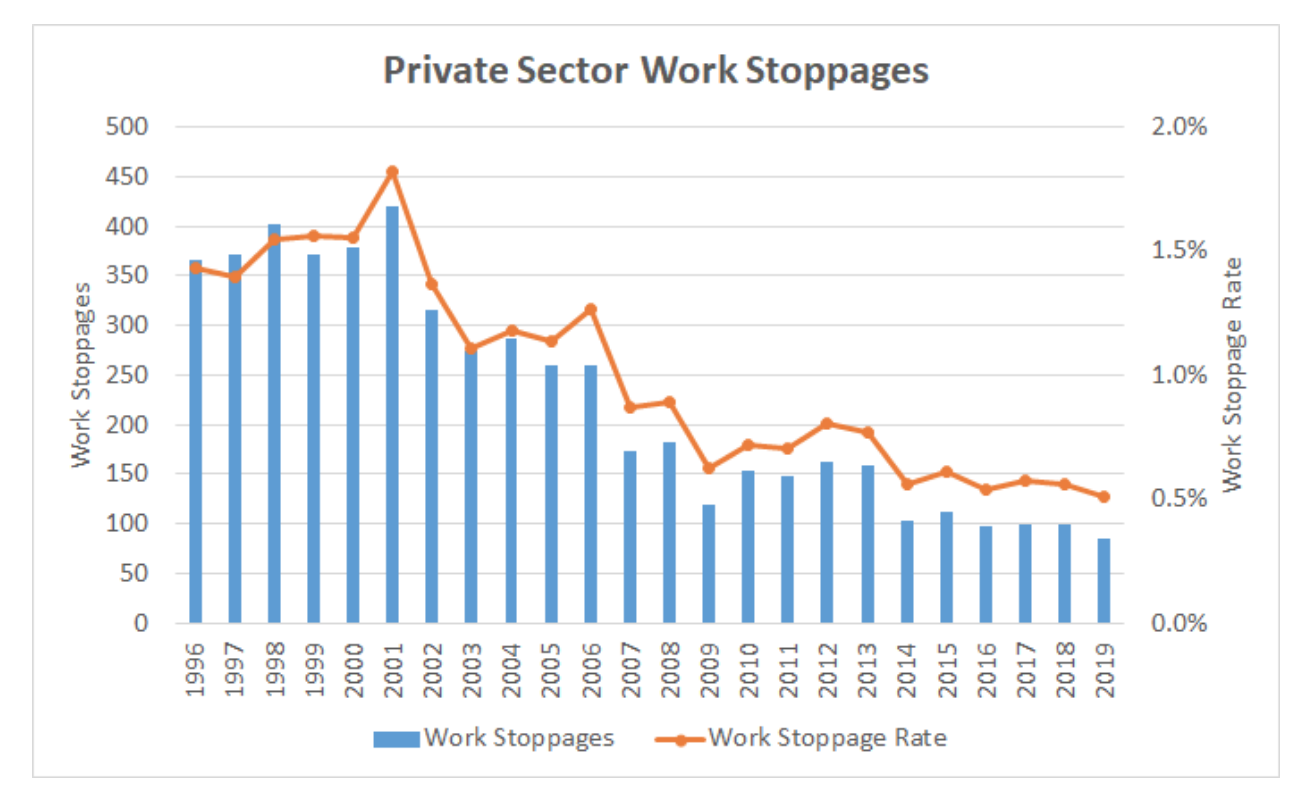
Below is a chart showing the number of private sector work stoppages arising from bargaining, and again, these are mostly strikes. Also shown is the percentage of contract negotiations that ended up in a work stoppage, which I call the work stoppage rate. I’m showing data going back to 1996, the oldest year I could get all the data needed. I did a previous analysis which has more information about this data.

The number of annual work stoppages declined from more than 300 in the late 1990s to below 100 in recent years. As private sector union membership has been shrinking, we would expect the number of work stoppages to also decline. The number of private sector union members in 1996 was 9.4 million, declining to 7.5 million in 2019, which is about a 20% decrease. But the number of work stoppages declined by much more than that, about 77%. That’s why the work stoppage rate, shown in the chart, has also declined dramatically, from around 1.5% in the late 1990s to the 0.5% range today.
This is just an alarming fall in private sector strikes. I’ve looked at the data a number of ways and at this point I can’t think of any explanation other than the obvious one – that the confidence to strike has eroded over time. This could be due to structural changes in the economy, such as globalization, automation, outsourcing, and plant closures, as well as employer anti-union actions, such as union-busting and using scabs to defeat strikes. I originally expected to see an increase in strike activity over the last few years due to the lower unemployment rate, which makes it more difficult for employers to bring in scabs, but it’s just not happening.
I should mention that there is another possible explanation for declining strike activity, which is that unions are increasingly able to get what they want in contract negotiations without striking. While that may be true in specific cases, it’s really unlikely to be an explanation for this long-term trend, given everything we know about labor’s decline. However, possibly it could explain the low numbers in more recent years when the unemployment rate has been low.
What does all of this mean?
In summary, union membership and density are declining, and NLRB elections are not organizing enough workers, even as the win rate is increasing. Furthermore, some large-scale strike activity is up in recent years, but the overall strike trend has been down in the private sector. The main problem, as always, is that the labor movement needs to find ways to help millions of workers to organize.
Of course, as I said earlier, NLRB elections are only one avenue for organizing, and their decrease is partly a result of unions turning toward other strategies. “Card check” is another principal method, where unions try to win recognition through a majority of workers signing authorization cards. Another example is in the building trades where workers can organize to get their contractors to recognize the union and sign a contract without an election. But however unions are organizing, the results are just not improving union membership and density enough, as the data shows.
What about other forms of organizing? Outside of mainstream union practices, the Industrial Workers of the World’s (IWW) “solidarity unionism” model depends on continuous direct action by workers to improve workplace conditions, and may not seek official recognition or a union contract. Furthermore, we can look outside of unions to worker centers or worker associations/advocacy groups (e.g. OUR Walmart, Fight for 15) which organize in a variety of ways outside of formal recognition and contract bargaining. This usually involves pressure campaigns to resolve wage theft cases or fighting for legislation to improve wages and working conditions.
It’s worth mentioning that worker center/association members are most likely not counted in official government union membership data, though IWW members might be, depending on how workers answer the Current Population Survey questions.
Employed wage and salary workers are classified as union members if they answer “yes” to the following question: On this job, are you a member of a labor union or of an employee association similar to a union? If the response is “no” to that question, then the interviewer asks a second question: On this job, are you covered by a union or employee association contract? If the response is “yes,” then these persons, along with those who responded “yes” to being union members, are classified as represented by a union. If the response is “no” to both the first and second questions, then they are classified as nonunion.
So overall, if we want to adopt the most expansive sense of the concept of “organizing,” it’s certainly true that the number of workers who are “organized” in any way is more than the government’s union membership data reveals. But while it’s difficult to know what that higher number is, we’re certainly not talking about millions more workers, more likely thousands or maybe tens of thousands.
Where to from here?
A full discussion of ways forward is certainly beyond the scope of this article, but here are some closing reflections.
There has been a decades-long conversation inside and outside the labor movement about the organizing crisis and how to turn all this around. Unions officially recognized this problem back in 1995 when John Sweeney’s New Voice slate took over the AFL-CIO and pushed for unions to organize more. The results since then have certainly been disappointing.
The discussion ever since has focused in part on how current workplace NLRB elections alone are not a successful method for large-scale organizing, and that labor law makes organizing far too difficult. This is particularly true when Republican administrations make the NLRB more hostile to workers. Many have advocated for various labor law reforms to make organizing easier and increase penalties for union-busting, and that would certainly be helpful.
But we know that the law often follows organizing power, that is, we get better laws when we have the union strength to force them to happen. Indeed, we could consider labor law to be the national “contract” or compromise between labor and capital that results from the prevailing balance of forces. Labor law reform failed to pass under the last four Democratic presidents — Johnson, Carter, Clinton and Obama — because labor was not strong enough to get it.
Moreover, there’s the left argument to consider that laws like the NLRA ultimately do some harm by locking unions into a complicated and legalistic labor-management framework that eventually pacifies them. We would have to consider whether that would be true for any reformed labor laws. If we want unions to be a key vehicle toward a revolutionary transformation of society, we need a labor law that leaves open the maximum amount of union freedom of action, including to strike (or we may need to ignore the law).
We also recognize that labor movements rarely grow slowly over time. Rather they experience periods of intense “upsurge” where millions of workers are angry and organizing. This happened in the U.S. in the 1930s-1940s in the private sector and the 1960s-1970s in the public sector. It’s impossible to know when we may enter another upsurge period, and it’s tempting to think we’re at the start of one now because of the recent strikes. Indeed, we hope that large, successful strikes inspire many more workers to organize, and they’ll need help. But whenever we hit that upsurge period, we can certainly lay the groundwork now as best we can, with organizing theories and practices that will best serve that moment.
At this point I’ll just suggest some broad principles. We need more organizing experimentation and much more resources going toward organizing, in whatever form it takes. This should be coupled with a long-term program to build up rank-and-file participation, democracy and militancy, as part of a broader culture of solidarity. Moreover, while we need to engage the electoral process, we also need to maintain an independent movement that doesn’t demobilize when political “allies” are in power, in favor of a “seat at the table.” Labor’s main weapon has always been the strike, so the labor movement has to generate the ability and confidence to strike and win much more often, and on larger scales, taking real risks along the way. It has to see its mission as fighting for the working class as a whole and not as a special interest serving only its members. And in my view, it should develop a long-term socialist perspective that is not just satisfied with a larger piece of the pie, but wants the whole bakery.